AI capex tracker
AI capex tracker
First published · Updated
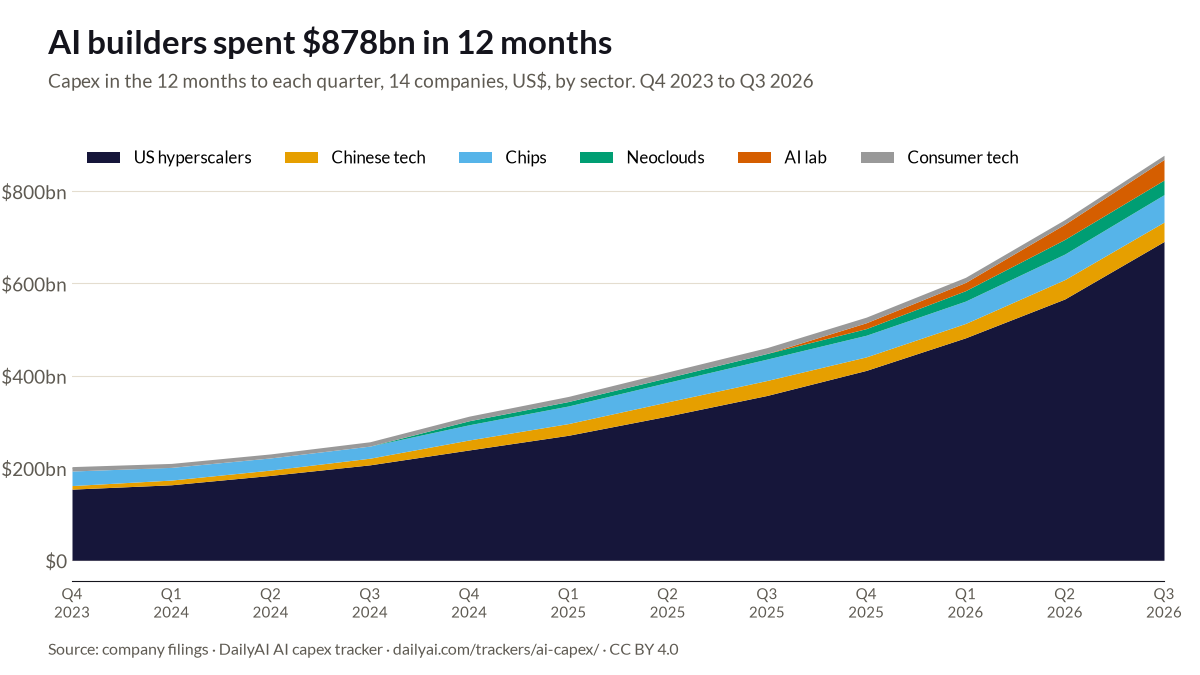
$878bn
14 companies building AI infrastructure spent $878bn on capex (capital expenditure: data centres, chips, servers and buildings) over the 12 months to their latest results. That is all of their capex, not just the part for AI.
All 14 companies’ capex over 12 months, by sector
How to read this: each point is the total spent in the 12 months to that quarter, Q4 2023 to Q3 2026. Hover or tap for values and the number of companies included.
Some companies only have figures from 2024 or 2025 (CoreWeave, Nebius and xAI). “Only companies with full history” shows the 11 companies with figures for every quarter, so you see the growth without new companies being added.
Neoclouds are newer companies that rent out AI computing power: CoreWeave and Nebius.
US$. Part of the rise is companies joining once we have a full year of their figures: CoreWeave in 2024, Nebius in 2025 and xAI in late 2025. Alibaba, CoreWeave, Tencent, Nebius, NVIDIA and Baidu have yet to report Q3 2026 and are shown with their latest 12 months.
US$. The same 11 companies at every point (Amazon, Alphabet, Microsoft, Meta, Oracle, Alibaba, Tencent, Baidu, TSMC, NVIDIA and Apple), so the rise is not caused by companies joining: $802bn in each company’s latest 12 months (to Q3 2026 or earlier), against $449bn a year earlier.
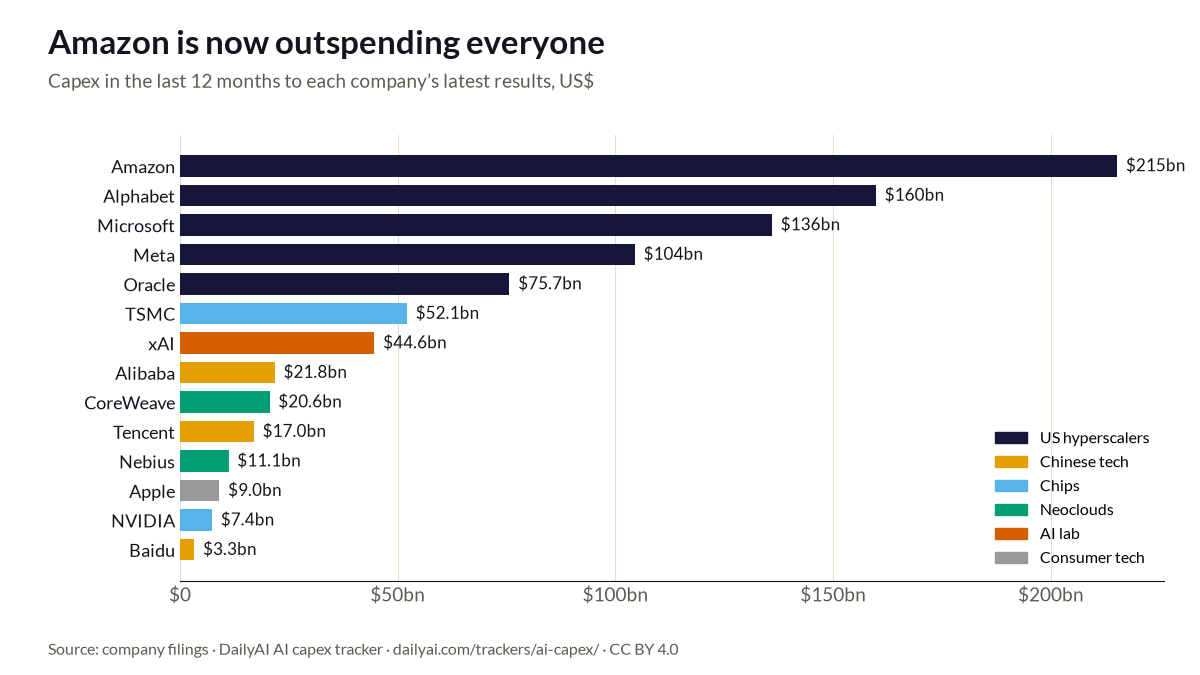
Amazon is now outspending everyone
Amazon spent $215bn in the last 12 months, $55.4bn more than Alphabet.
How to read this: one bar per company, longest first. Switch the period or filter by sector; tap a bar for details.
Capex, US$. 12-month periods end September 2026 unless marked. Renminbi converted at Fed average rates; TSMC in its own US$ figures. xAI’s figures are those of the SpaceX business unit that contains it (SpaceX calls it the SI segment), which also includes X and, since Q3 2026, Cursor. Calendar years show only companies with all four quarters.
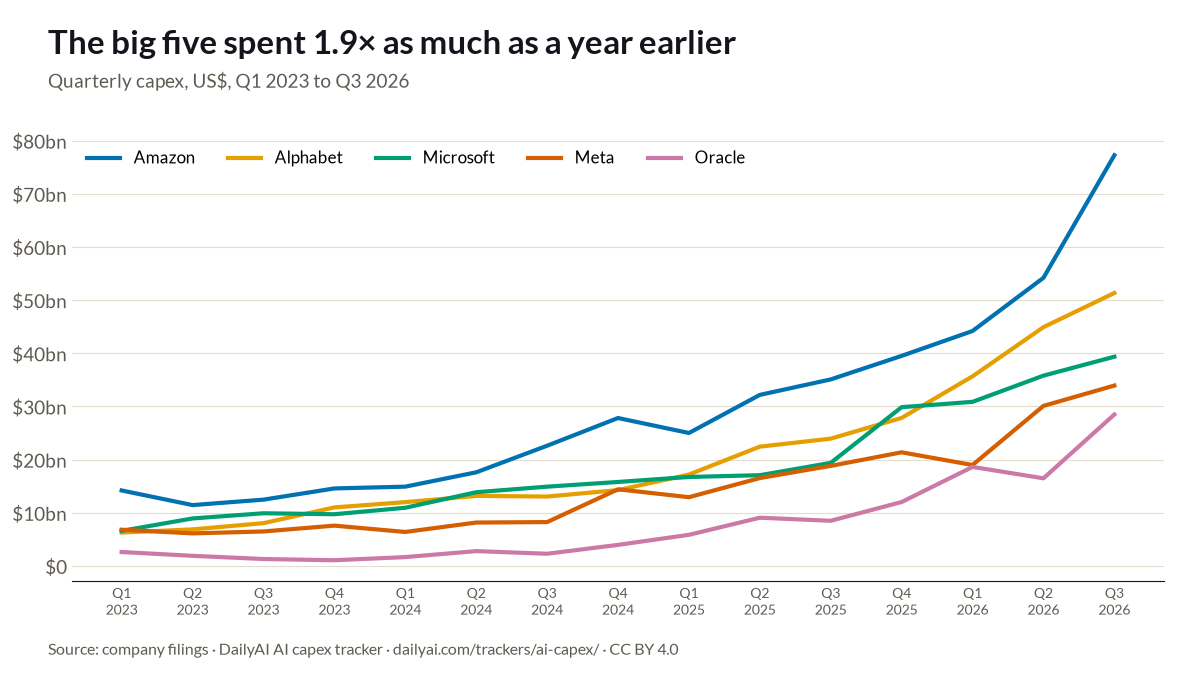
The big five spent 1.9 times as much as a year earlier
Comparing the last 12 months with the 12 months before. In Q3 2026 alone they spent $230bn, 2.2× the same quarter a year earlier.
How to read this: one line per company. Pick up to six; tap the chart for values.
Capex, US$, by calendar quarter.
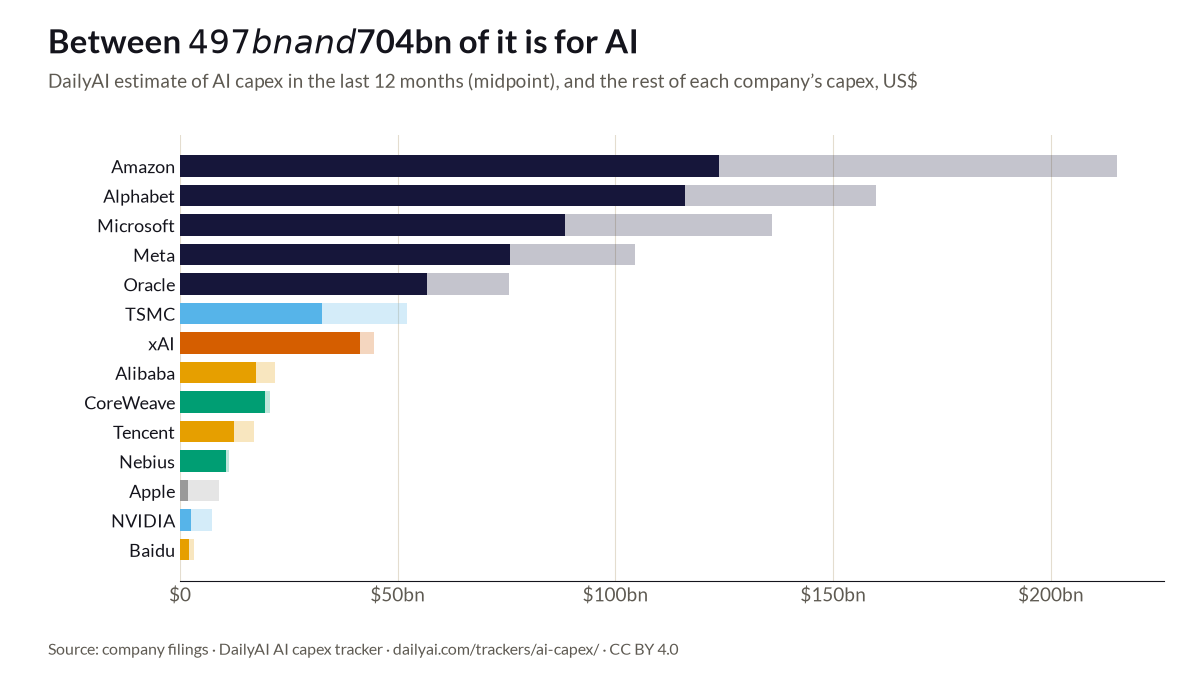
Between $497bn and $704bn of it is for AI
No company splits out AI spending. Our estimates cover the last 12 months only; slide between their low and high ends.
How to read this: the solid part of each bar is estimated AI capex, the pale part the rest of the company’s capex.
US$, last 12 months. Midpoint of all estimates: $601bn. Methods by company are under Data and methods.
Every company but Apple is spending more than a year ago
Biggest rise in dollars on the previous quarter: Amazon, up $23.1bn (+43%). Apple, CoreWeave and TSMC spent less than in the previous quarter. Latest quarter is Q3 2026 unless marked.
| US hyperscalers | ||||||
| Amazon | $77.3bn | +43% | +120% | 38% | 27% | 45–70% |
| Alphabet | $51.4bn | +14% | +114% | 40% | 34% | 60–85% |
| Microsoft | $39.4bn | +10% | +103% | 43% | 39% | 55–75% |
| Meta | $33.9bn | +13% | +80% | 53% | 43% | 60–85% |
| Oracle | $28.5bn | +73% | +235% | 147% | 105% | 60–90% |
| Chinese tech | ||||||
| AlibabaQ2 2026 | $9.9bn | +159% | +86% | 25% | 15% | 70–90% |
| TencentQ2 2026 | $7.8bn | +68% | +194% | 26% | 15% | 60–85% |
| BaiduQ2 2026 | $1.7bn | +96% | +219% | 36% | 18% | 50–80% |
| Chips | ||||||
| TSMC | $13.8bn | −12% | +42% | 30% | 33% | 50–75% |
| NVIDIAQ2 2026 | $2.7bn | +52% | +41% | 3% | 2% | 20–50% |
| Neoclouds | ||||||
| CoreWeaveQ2 2026 | $6.4bn | −17% | +162% | 249% | 271% | 90–100% |
| NebiusQ2 2026 | $5.7bn | +129% | +1,008% | 972% | 822% | 90–100% |
| AI lab | ||||||
| xAI | $16.4bn | +4% | +245% | – | – | 85–100% |
| Consumer tech | ||||||
| Apple | $2.2bn | −9% | −31% | 2% | 2% | 10–30% |
US$. AI share is our estimate for the last 12 months; no company discloses one. Applied to the $878bn total, it implies $497bn–$704bn of AI capex.
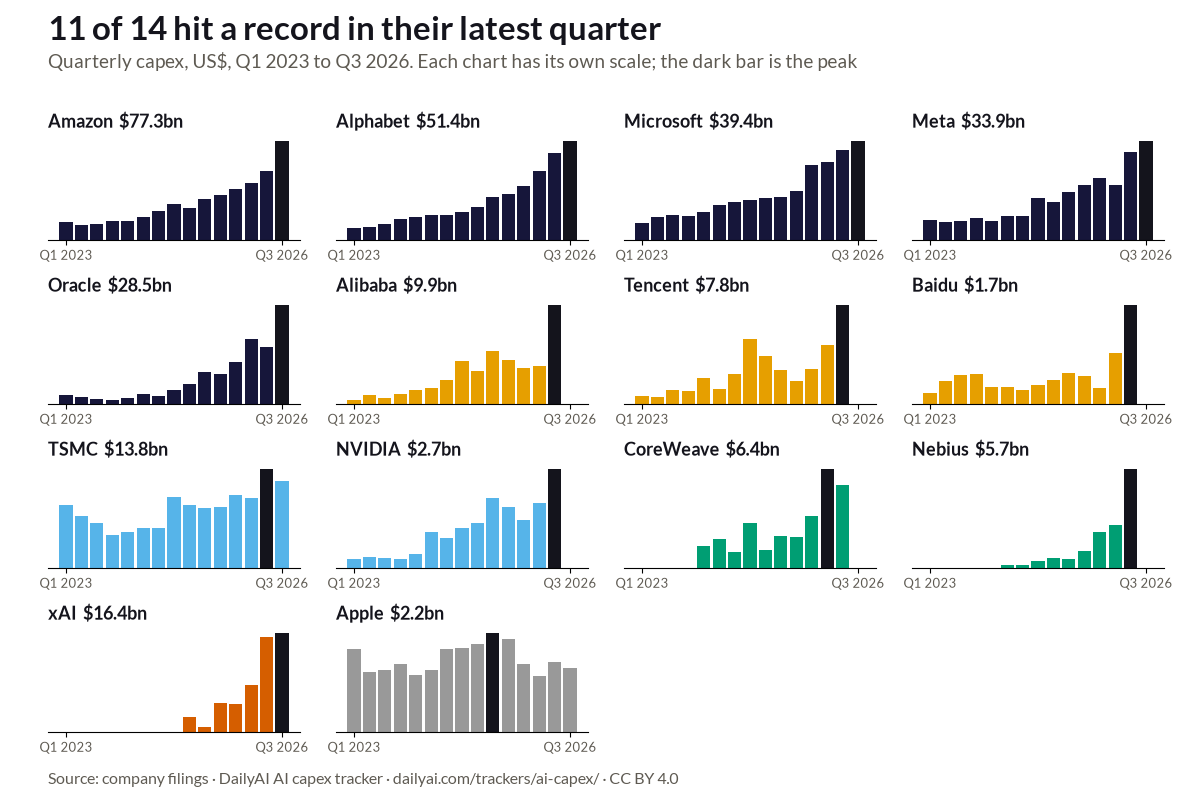
11 of 14 hit a record in their latest quarter
The exceptions: TSMC, CoreWeave and Apple. Records are judged in each company’s own currency.
How to read this: quarterly capex, Q1 2023 to Q3 2026, US$. Each chart has its own scale; the dark bar is the peak. Tap a bar for its value.
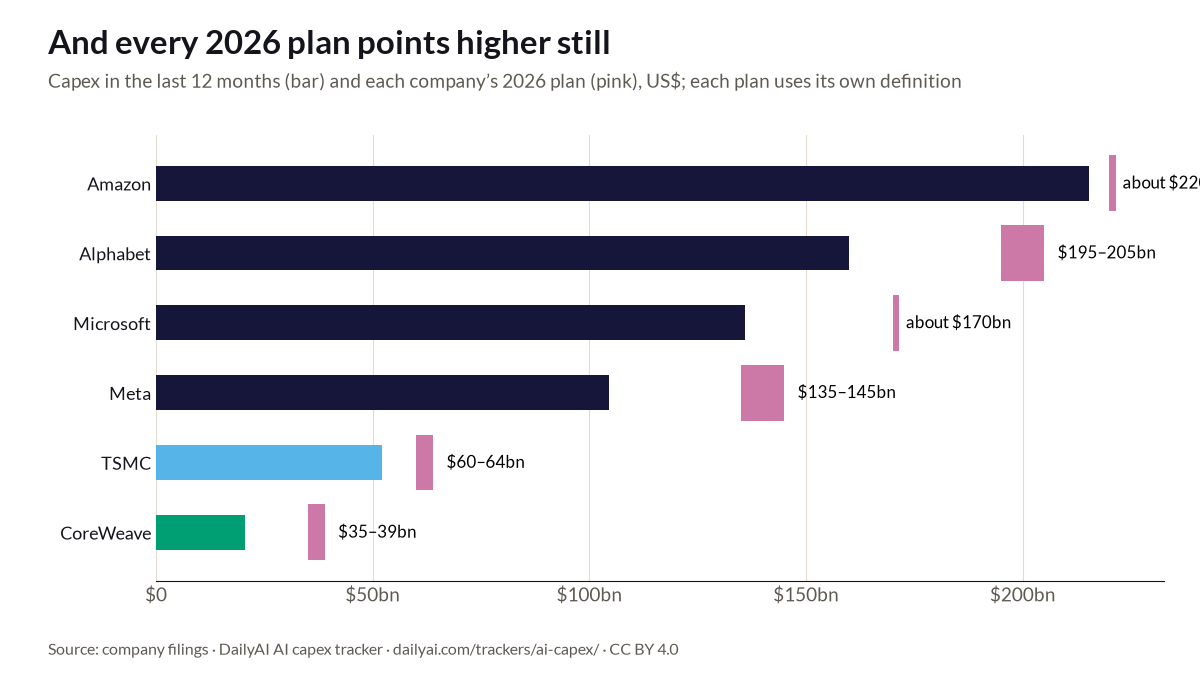
And every 2026 plan points higher still
What each company has told investors it expects to spend in 2026, against what it spent in the last 12 months. Each uses its own definition of spending.
How to read this: the bar is the last 12 months; the pink mark is the 2026 plan.
What the plans imply for October to December
Each plan minus what the company spent from January to September, measured the same way the company measures its plan. On these numbers Amazon would spend about $47.8bn in October–December, 63% of the $75.9bn it spent from July to September.
| Company | Spent Jan–Sep 2026 | 2026 plan | Implied Oct–Dec | Spent Jul–Sep |
|---|---|---|---|---|
| Amazonnet of proceeds from asset sales and incentives | $172bn | about $220bn | $47.8bn | $75.9bn |
| Alphabetpurchases of property and equipment | $132bn | $195–205bn | $63.0–73.0bn | $51.4bn |
| Microsoftincludes finance leases | $118bn | about $170bn | $51.9bn | $45.2bn |
| Metaincludes finance-lease principal payments | $85.8bn | $135–145bn | $49.2–59.2bn | $34.9bn |
US$. Amazon: purchases of property and equipment net of proceeds and incentives. Microsoft: including finance leases. Meta: including principal payments on finance leases. Alphabet: purchases of property and equipment.
Their 2026 plans, in their own words
- Amazon2026: about $220bnnet of proceeds and incentives
We continue to expect 2026 cash capital expenditures to be approximately $220 billion.
Amazon earnings release, 29 Oct 2026 · source - Alphabet2026: $195–205bn
… our full‑year 2026 CapEx guidance range of $195‑$205 billion remain unchanged.
Anat Ashkenazi, CFO, earnings call (official transcript), 28 Oct 2026 · source - Microsoft2026: about $170bnincludes finance leases
… for the calendar year, spend should be approximately $170 billion …
Amy Hood, CFO, earnings call, 28 Oct 2026 · source - Meta2026: $135–145bnincludes finance-lease principal payments
We anticipate 2026 capital expenditures, including principal payments on finance leases, to be in the range of $135-145 billion …
Meta earnings release, 21 Oct 2026 · source - TSMC2026: $60–64bn
… we reiterate our full year 2026 capital budget to be between USD60 billion and USD64 billion.
Wendell Huang, CFO, earnings call, 15 Oct 2026 · source - AlibabaAt least $53bn over three yearsfrom Feb 2025; cloud and AI, not total capex
… plans to invest at least RMB380 billion (US$53 billion) over the next three years to advance its cloud computing and AI infrastructure
Alibaba announcement, 24 Feb 2025 · source - CoreWeave2026: $35–39bncompany-defined capex
FY’26 Guidance: Capital Expenditures $35 – 39 billion
CoreWeave earnings presentation, 11 Aug 2026 · source
No published 2026 plan found for Oracle, xAI, Tencent, Nebius, Apple, NVIDIA or Baidu.
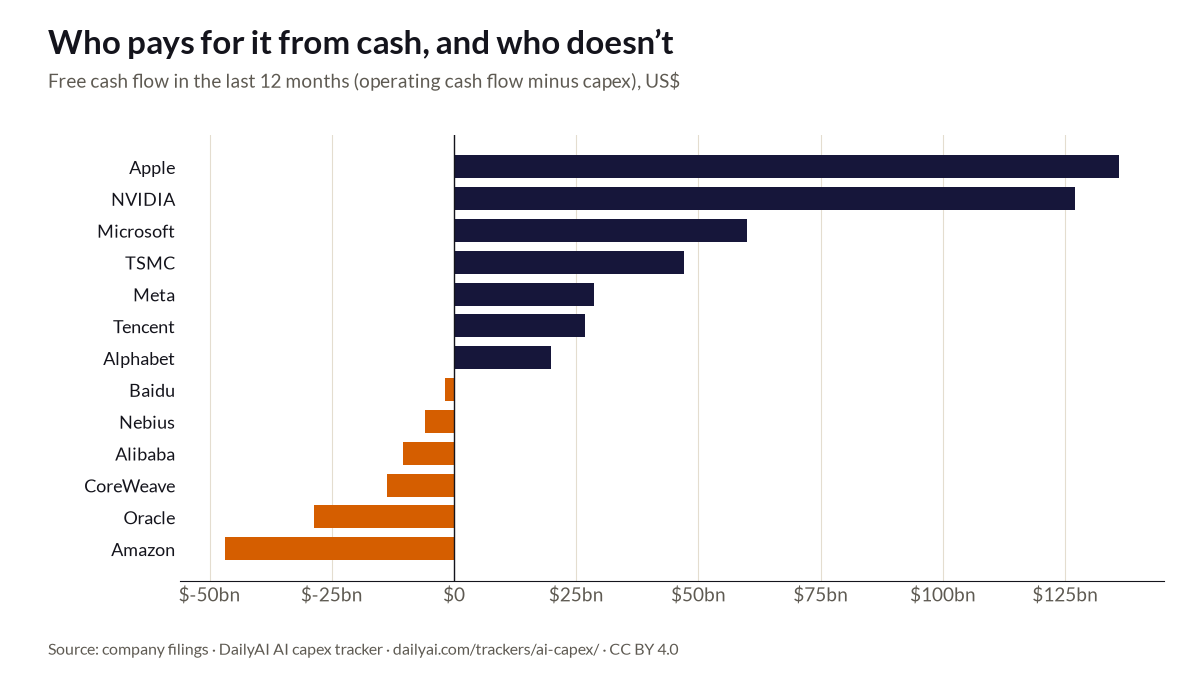
Six of 14 spent more than their operating cash flow on capex
Baidu, Nebius, Alibaba, CoreWeave, Oracle and Amazon had negative free cash flow in the last 12 months. Free cash flow is operating cash flow minus capex. Where it is negative, the spending is paid for with borrowing, cash reserves or customers’ money.
How to read this: bars to the right are cash left after capex; bars to the left are a shortfall. Last 12 months, US$.
| Company | Free cash flow, last 12 months | Capex as a share of operating cash flow, last 12 months | Total debt, quarter end | Debt change over 12 months |
|---|---|---|---|---|
| Apple | $136bn | 6% | $80.1bn | −$18.6bn |
| NVIDIA | $127bn | 5% | $33.4bn | +$24.9bn |
| Microsoft | $60.0bn | 69% | $35.5bn | −$7.7bn |
| TSMC | $47.0bn | 53% | $25.7bn | −$4.5bn |
| Meta | $28.6bn | 78% | $83.7bn | +$54.8bn |
| Tencent | $26.7bn | 39% | $66.8bn | +$11.8bn |
| Alphabet | $19.7bn | 89% | $126bn | +$99.5bn |
| Baidu | −$1.8bn | 229% | $15.3bn | +$3.6bn |
| Nebius* | −$5.9bn | 212% | $8.5bn | +$7.6bn |
| Alibaba | −$10.5bn | 194% | $39.3bn | +$6.9bn |
| CoreWeave* | −$13.7bn | 298% | $35.6bn | +$24.5bn |
| Oracle* | −$28.7bn | 161% | $125bn | +$34.0bn |
| Amazon | −$46.9bn | 128% | $181bn | +$126bn |
* Operating cash flow includes large customer prepayments, which flatter it. Oracle’s Q3 2026 cash flow includes $11.4bn of deferred revenue from customer prepayments. xAI does not report cash flow or debt. Debt is borrowings and commercial paper, not leases.
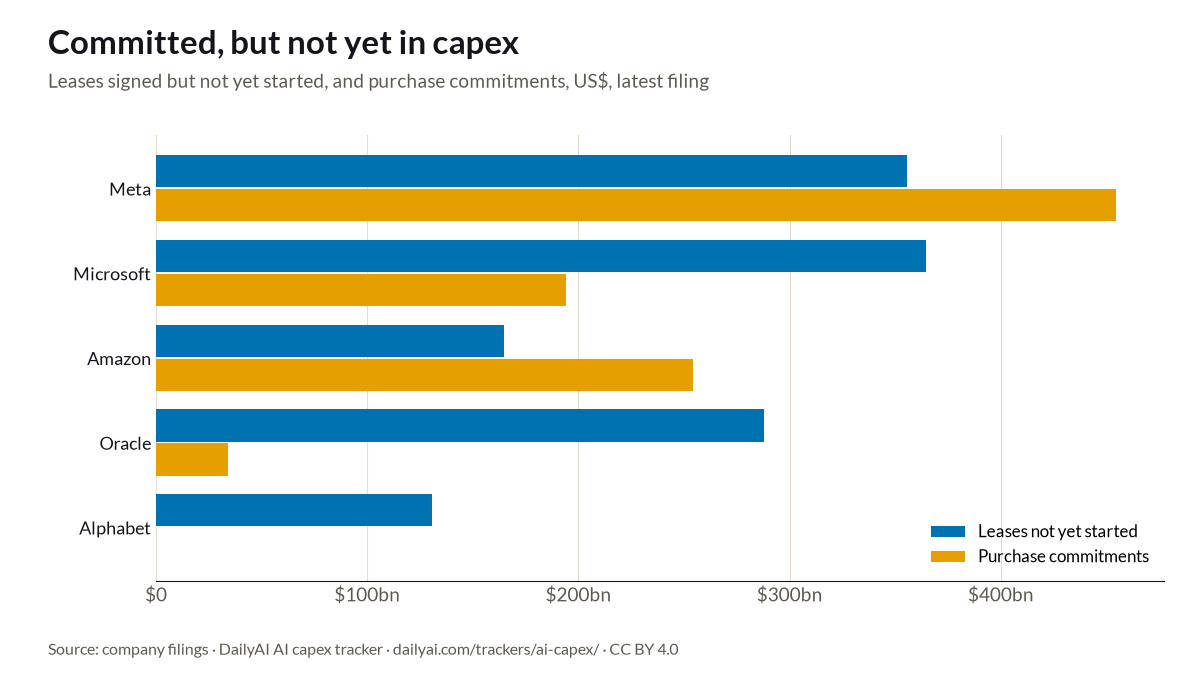
Committed, but not yet in capex
Leased data centres and many supply deals do not show up in capex until they start. These are the amounts companies say they are already committed to.
How to read this: two bars per company, from its latest filing: leases signed but not yet started, and purchase commitments. Last 12 months’ capex is shown for scale.
US$bn. Definitions differ: Meta’s commitments are mostly cloud capacity; Amazon’s are property and equipment plus other purchase obligations; Alphabet does not give a comparable total. Not added to any total.
Next updates
We update each company within a day of its results.
| Company | Results for | Date |
|---|---|---|
| CoreWeave | Jul–Sep 2026 | 10 Nov 2026 |
| Nebius | Jul–Sep 2026 | 12 Nov 2026 |
| Baidu | Jul–Sep 2026 | 16 Nov 2026 |
| NVIDIA | Aug–Oct 2026 | 17 Nov 2026 |
| Tencent | Jul–Sep 2026 | 18 Nov 2026 |
| Alibaba | Jul–Sep 2026 | Date to be confirmed |
| Oracle | Sep–Nov 2026 | Date to be confirmed |
| Apple | Oct–Dec 2026 | Date to be confirmed |
The others report October–December results from mid-January; dates to be confirmed.
Data and methods
What we measure
Capex is purchases of property and equipment from each company’s cash flow statement, as filed. It covers the whole company, not just AI: Amazon’s includes warehouses and satellites; Meta’s includes non-AI servers. Free cash flow is operating cash flow minus this capex.
The $878bn headline and every chart cover all 14 companies’ capex. The “big five” totals (Amazon, Alphabet, Microsoft, Meta and Oracle) count only those five. TSMC, CoreWeave and Alibaba’s spending plans are shown next to the big five’s but are never added to them; Alibaba’s is a three-year plan, not a yearly one.
Exceptions: Tencent counts capex when the spending is committed (accrual basis), not when the cash is paid. Alibaba’s line is “purchase of property and equipment and intangible assets (excluding land use rights and construction in progress relating to office campuses)”. NVIDIA’s and Nebius’s include intangible assets such as software (Nebius’s releases before 2026 used a label without them, for the same figures). xAI’s is the capex of SpaceX’s AI business, called the “AI segment” in SpaceX’s listing documents and the “SI segment” since Q3 2026; its 2025 quarters come from the S-1/A and from comparative columns in later 10-Qs. Renminbi figures use the US Federal Reserve’s published quarterly average exchange rate (its H.10 series). TSMC’s US$ figures are those TSMC states; where it gives none, we use its own average rate.
Periods
Every column says whether it is the latest quarter or the last 12 months (the latest four quarters added together). Microsoft’s year ends in June, Oracle’s in May, NVIDIA’s in January, Apple’s in September and Alibaba’s in March. Each fiscal quarter is placed in the calendar quarter containing its midpoint. Companies report at different times, so the latest quarter is not the same for all. A record is the highest quarterly capex in the company’s own currency since 2023.
Sources
Every figure links to the company’s own filing or release. A few quarters are taken from a later filing, which repeats the earlier quarter’s figures for comparison; these are marked “(from later filing)” in the full table. Some quarters are worked out from year-to-date figures; the data download says which.
Operating cash flow is higher than revenue in eight quarterly results (Oracle, CoreWeave and Nebius), because customers paid in advance. We checked each against the filing.
AI share
No company splits AI from other capex. Our range for each is based on what it says its capex buys, and applies to the last 12 months only; we do not apply it to earlier periods.
Method by company
- Amazon, 45–70%: Amazon’s capex covers AWS plus fulfilment, transport and Kuiper satellites. It said 2026 spend is “predominantly in AWS” but does not split AI from other AWS spend. Low end: AWS share less non-AI compute. High end: most AWS spend AI-related. Evidence
- Alphabet, 60–85%: On its Q3 2026 call, Alphabet said capex was $51.4bn "with the vast majority of the spend in technical infrastructure to support our investments in AI", and that about 65% of its technical-infrastructure investment went on servers and networking equipment and 35% on data centres (official transcript). Low end: the servers-and-networking share less non-AI servers. High end: 85% is DailyAI’s own assumption for “vast majority”; Alphabet gave no percentage. Evidence
- Microsoft, 55–75%: Microsoft attributes its capex growth to “cloud and AI infrastructure” on every call since 2023 and says the mix is shifting to short-lived assets (servers, incl. GPUs and CPUs) that track AI and cloud revenue. Low end: short-lived share treated as mostly AI, sites as mostly non-AI. High end: most new data-centre sites also built for AI. Microsoft gives no AI split. Evidence
- Meta, 60–85%: Meta says capex supports “both our generative AI efforts and core business” and that servers include “both non-AI and AI hardware”. Its ranking and recommendation systems are AI too; we count only generative-AI and AI-training capacity at the low end. Evidence
- Oracle, 60–90%: Oracle’s capex is almost all OCI data centres and equipment, and its contract backlog growth is dominated by AI training and inference contracts. Oracle gives no AI split; the range is wide on purpose. Evidence
- Alibaba, 70–90%: Alibaba says its capex goes to cloud and AI infrastructure under its three-year plan, and its Aug 2026 release links the rise to CPU compute for AI agents and chip prices. Some spend serves non-AI cloud and commerce. Evidence
- Tencent, 60–85%: Tencent’s releases describe capex payments as “primarily to support our AI initiatives”. The rest serves games, social and non-AI cloud. Evidence
- Baidu, 50–80%: Baidu’s capex funds AI Cloud and Ernie model compute plus iQIYI and other businesses. No AI split disclosed. Evidence
- TSMC, 50–75%: Proxy: TSMC’s high-performance-computing platform share of revenue (its quarterly management report), which is mainly AI accelerators and server CPUs on advanced nodes. Capacity also serves smartphones and other platforms. Evidence
- NVIDIA, 20–50%: NVIDIA’s own capex (not its sales) covers offices, labs and its in-house research and DGX Cloud compute. No AI split disclosed; the range is a judgement. Evidence
- CoreWeave, 90–100%: CoreWeave is a GPU cloud; capex is GPUs, networking and data centres for AI workloads. Evidence
- Nebius, 90–100%: Nebius’s capex is GPUs, GPU-related hardware and data-centre build-out for its AI cloud. Evidence
- xAI, 85–100%: SpaceX’s SI segment (formerly AI) is xAI’s Colossus compute plus X and, from Q3 2026, Cursor. Most segment capex is AI compute; X platform spend is the main non-AI part. Evidence
- Apple, 10–30%: Apple’s capex mostly funds manufacturing tooling, retail and corporate facilities, and data centres (incl. Private Cloud Compute servers for Apple Intelligence). No AI split disclosed. Evidence
Guidance
We quote a plan only from a company’s written release or an official transcript published by the company, word for word; … marks a cut. A plan given only on a call with no official transcript is left out until one is published. That is why Oracle’s plan for its 2027 financial year is not shown: it was given only on its earnings call. Microsoft’s figure includes finance leases, Meta’s adds finance-lease principal payments and Amazon’s is net of proceeds and incentives, so they don’t match the capex above exactly. All 96 guidance quotes since 2023 are in the JSON download.
Spending outside capex
- Meta’s joint ventures. Meta owns 20% of two ventures building data-centre campuses in Louisiana and Texas, with estimated costs of about $27bn and $14bn, and leases the capacity back. They are not consolidated.
- Oracle’s financing. Oracle’s own “net” capex deducts customer prepayments and financing tied to capex: $7.9bn in its 2026 fiscal year and $10.5bn in the quarter to August 2026. We show its gross figure.
Commitments not yet in capex, with sources
- Microsoft, leases not yet started: $364.6bn at 30 Sep 2026. “leases that have not yet commenced of $364.6 billion”. Filing
- Microsoft, purchase commitments: $194.1bn at 30 Jun 2026. “Purchase commitments (primarily relate to datacenters), contractual obligations table, 194,060”. Filing
- Meta, leases not yet started: $355.7bn at 30 Sep 2026. “leases that have not yet commenced … approximately $355.73 billion”. Filing
- Meta, purchase commitments: $454.5bn at 30 Sep 2026. “$454.52 billion of non-cancelable contractual commitments … mostly relate to third-party cloud capacity arrangements and investments in servers and network infrastructure”. Filing
- Alphabet, leases not yet started: $130.5bn at 30 Sep 2026. “leases that have not yet commenced … $130.5 billion”. Filing
- Amazon, leases not yet started: $164.9bn at 30 Sep 2026. “Leases not yet commenced, commitments table, total 164,922”. Filing
- Amazon, purchase commitments: $254.4bn at 30 Sep 2026. “Commitments table: property and equipment 159,640 plus unconditional purchase obligations 94,759”. Filing
- Oracle, leases not yet started: $288.0bn at 31 Aug 2026. “$288 billion of additional lease commitments, substantially all related to data center arrangements”. Filing
- Oracle, purchase commitments: $34.2bn at 31 Aug 2026. “unconditional purchase and certain other obligations … Total 34,150”. Filing
Private AI labs
OpenAI doesn’t publish its capex. Anthropic does, in its stock-market filing: $482m in the first half of 2026. That is small because it rents almost all its computing power, so it is not comparable with the companies above and is not charted. The labs’ announced commitments are listed here and not added to any total.
Announced commitments
- OpenAI, $500bn (21 Jan 2025, 2025-2029): Stargate: “intends to invest $500 billion over the next four years building new AI infrastructure for OpenAI in the United States”. Stargate joint venture (SoftBank, OpenAI, Oracle, MGX equity funders). Joint-venture commitment; not OpenAI’s own capex. Company announcement
- OpenAI, $300bn (23 Sep 2025, 2025-2030): OpenAI-Oracle agreement for up to 4.5 GW of additional Stargate capacity, “a partnership that exceeds $300 billion between the two companies over the next five years”. OpenAI pays Oracle for capacity; Oracle builds; already in Oracle’s capex. Company announcement
- OpenAI, $450bn (30 Oct 2025, 2025-2028): Stargate at “over 8 gigawatts of planned capacity and more than $450 billion in investment over the next three years”. Stargate partners. Planned investment across partners. Company announcement
- OpenAI (29 Apr 2026, by 2029): “committed to securing 10GW of AI infrastructure in the United States by 2029 … we have already surpassed that milestone”. Stargate partners. Capacity milestone; no dollar figure given. Company announcement
- Anthropic, $50bn (12 Nov 2025, sites online through 2026): “a $50 billion investment in American computing infrastructure, building data centers with Fluidstack in Texas and New York”. Anthropic with Fluidstack. Total programme; no quarterly spend disclosed. Company announcement
- Anthropic (3 Jun 2026, through May 2029): Cloud Services Agreements with SpaceX: “the customer has agreed to pay us $1.25 billion per month through May 2029” for about 325,000 NVIDIA GPUs on Colossus and Colossus II. Anthropic pays SpaceX (compute purchase; opex for Anthropic). Compute rental, not capex; terminable on 90 days’ notice after the first three months. Sec filing (counterparty)
- Anthropic (26 Oct 2026, terms of up to 20 years): IPO filing (S-1): at 30 June 2026, “expected future fixed or minimum guaranteed commitments” for compute and infrastructure “were approximately $265.6 billion”, plus leases not yet started of “$321.4 billion”. Anthropic pays cloud providers and lessors (mostly operating costs and leases for Anthropic). Capex itself was $131m in 2025 and $482m in the first half of 2026. The filing has not yet filled in its own combined total. Sec filing
Full data
All metrics by company
| Company | Capex, latest quarter | vs prior quarter | vs year earlier | Capex, last 12 months | AI share (est.) | AI capex, mid (est., last 12 months) | Revenue, last 12 months | Operating cash flow, last 12 months | Free cash flow, last 12 months | Capex as a share of revenue, latest quarter | Capex as a share of revenue, last 12 months | Capex as a share of operating cash flow, last 12 months | Total debt, quarter end |
|---|---|---|---|---|---|---|---|---|---|---|---|---|---|
| AmazonQ3 2026 · reports in USD | $77.3bn | +43% | +120% | $215bn | 45–70% | $124bn | $797bn | $168bn | −$46.9bn | 38% | 27% | 128% | $181bn |
| AlphabetQ3 2026 · reports in USD | $51.4bn | +14% | +114% | $160bn | 60–85% | $116bn | $471bn | $180bn | $19.7bn | 40% | 34% | 89% | $126bn |
| MicrosoftQ3 2026 (fiscal 2027 Q1) · reports in USD | $39.4bn | +10% | +103% | $136bn | 55–75% | $88.3bn | $346bn | $196bn | $60.0bn | 43% | 39% | 69% | $35.5bn |
| MetaQ3 2026 · reports in USD | $33.9bn | +13% | +80% | $104bn | 60–85% | $75.7bn | $242bn | $133bn | $28.6bn | 53% | 43% | 78% | $83.7bn |
| OracleQ3 2026 (fiscal 2027 Q1) · reports in USD | $28.5bn | +73% | +235% | $75.7bn | 60–90% | $56.7bn | $71.8bn | $46.9bn | −$28.7bn | 147% | 105% | 161% | $125bn |
| AlibabaQ2 2026 (fiscal 2027 Q1) · reports in CNY | $9.9bn | +159% | +86% | $21.8bn | 70–90% | $17.4bn | $149bn | $11.2bn | −$10.5bn | 25% | 15% | 194% | $39.3bn |
| TencentQ2 2026 · reports in CNY | $7.8bn | +68% | +194% | $17.0bn | 60–85% | $12.3bn | $113bn | $43.7bn | $26.7bn | 26% | 15% | 39% | $66.8bn |
| BaiduQ2 2026 · reports in CNY | $1.7bn | +96% | +219% | $3.3bn | 50–80% | $2.1bn | $18.2bn | $1.4bn | −$1.8bn | 36% | 18% | 229% | $15.3bn |
| TSMCQ3 2026 · reports in TWD | $13.8bn | −12% | +42% | $52.1bn | 50–75% | $32.6bn | $157bn | $99.1bn | $47.0bn | 30% | 33% | 53% | $25.7bn |
| NVIDIAQ2 2026 (fiscal 2027 Q2) · reports in USD | $2.7bn | +52% | +41% | $7.4bn | 20–50% | $2.6bn | $303bn | $134bn | $127bn | 3% | 2% | 5% | $33.4bn |
| CoreWeaveQ2 2026 · reports in USD | $6.4bn | −17% | +162% | $20.6bn | 90–100% | $19.5bn | $7.6bn | $6.9bn | −$13.7bn | 249% | 271% | 298% | $35.6bn |
| NebiusQ2 2026 · reports in USD | $5.7bn | +129% | +1,008% | $11.1bn | 90–100% | $10.6bn | $1.4bn | $5.3bn | −$5.9bn | 972% | 822% | 212% | $8.5bn |
| xAIQ3 2026 · reports in USD | $16.4bn | +4% | +245% | $44.6bn | 85–100% | $41.3bn | – | – | – | – | – | – | – |
| AppleQ3 2026 (fiscal 2026 Q4) · reports in USD | $2.2bn | −9% | −31% | $9.0bn | 10–30% | $1.8bn | $479bn | $145bn | $136bn | 2% | 2% | 6% | $80.1bn |
All 187 quarterly results (one row per company per quarter), with sources
| Quarter | Company | Fiscal period | Currency | Capex, local (m) | FX rate | Capex, US$m | Revenue, US$m | Operating cash flow, US$m | Source |
|---|---|---|---|---|---|---|---|---|---|
| Q3 2026 | Amazon | FY2026 Q3 | USD | 77,259 | 77,259 | 201,944 | 42,422 | Source | |
| Q3 2026 | Alphabet | FY2026 Q3 | USD | 51,355 | 51,355 | 127,577 | 42,290 | Source | |
| Q3 2026 | Microsoft | FY2027 Q1 | USD | 39,367 | 39,367 | 92,279 | 58,000 | Source | |
| Q3 2026 | Meta | FY2026 Q3 | USD | 33,942 | 33,942 | 64,601 | 32,785 | Source | |
| Q3 2026 | Oracle | FY2027 Q1 | USD | 28,499 | 28,499 | 19,345 | 23,103 | Source | |
| Q3 2026 | TSMC | FY2026 Q3 | TWD | 443,210 | 31.98 | 13,800 | 46,724 | 28,761 | Source |
| Q3 2026 | xAI | 2026 Q3 | USD | 16,444 | 16,444 | – | – | Source | |
| Q3 2026 | Apple | FY2026 Q4 | USD | 2,242 | 2,242 | 114,477 | 28,101 | Source | |
| Q2 2026 | Amazon | FY2026 Q2 | USD | 54,208 | 54,208 | 200,606 | 45,387 | Source | |
| Q2 2026 | Alphabet | FY2026 Q2 | USD | 44,924 | 44,924 | 119,796 | 39,069 | Source | |
| Q2 2026 | Microsoft | FY2026 Q4 | USD | 35,802 | 35,802 | 90,007 | 55,441 | Source | |
| Q2 2026 | Meta | FY2026 Q2 | USD | 30,116 | 30,116 | 60,801 | 31,862 | Source | |
| Q2 2026 | Oracle | FY2026 Q4 | USD | 16,493 | 16,493 | 19,184 | 14,620 | Source | |
| Q2 2026 | Alibaba | FY2027 Q1 | CNY | 67,660 | 6.8048 | 9,943 | 39,524 | 3,372 | Source |
| Q2 2026 | Tencent | 2026 Q2 | CNY | 52,784 | 6.8048 | 7,757 | 30,094 | 7,744 | Source |
| Q2 2026 | Baidu | FY2026 Q2 | CNY | 11,390 | 6.8048 | 1,674 | 4,603 | 505 | Source |
| Q2 2026 | TSMC | FY2026 Q2 | TWD | 496,000 | 31.6 | 15,696 | 40,202 | 24,790 | Source |
| Q2 2026 | NVIDIA | FY2027 Q2 | USD | 2,677 | 2,677 | 96,221 | 24,077 | Source | |
| Q2 2026 | CoreWeave | FY2026 Q2 | USD | 6,422 | 6,422 | 2,575 | 679 | Source | |
| Q2 2026 | Nebius | FY2026 Q2 | USD | 5,657 | 5,657 | 582 | 2,246 | Source | |
| Q2 2026 | xAI | 2026 Q2 | USD | 15,828 | 15,828 | – | – | Source | |
| Q2 2026 | Apple | FY2026 Q3 | USD | 2,455 | 2,455 | 109,417 | 34,369 | Source | |
| Q1 2026 | Amazon | FY2026 Q1 | USD | 44,203 | 44,203 | 181,519 | 26,032 | Source | |
| Q1 2026 | Alphabet | FY2026 Q1 | USD | 35,674 | 35,674 | 109,896 | 45,790 | Source | |
| Q1 2026 | Microsoft | FY2026 Q3 | USD | 30,876 | 30,876 | 82,886 | 46,679 | Source | |
| Q1 2026 | Meta | FY2026 Q1 | USD | 18,997 | 18,997 | 56,311 | 32,226 | Source | |
| Q1 2026 | Oracle | FY2026 Q3 | USD | 18,635 | 18,635 | 17,190 | 7,151 | Source | |
| Q1 2026 | Tencent | 2026 Q1 | CNY | 31,936 | 6.9218 | 4,614 | 28,382 | 14,649 | Source |
| Q1 2026 | Alibaba | FY2026 Q4 | CNY | 26,588 | 6.9218 | 3,841 | 35,161 | 1,360 | Source |
| Q1 2026 | Baidu | FY2026 Q1 | CNY | 5,916 | 6.9218 | 855 | 4,634 | 386 | Source |
| Q1 2026 | TSMC | FY2026 Q1 | TWD | 350,760 | 31.59 | 11,104 | 35,901 | 22,126 | Source |
| Q1 2026 | NVIDIA | FY2027 Q1 | USD | 1,757 | 1,757 | 81,615 | 50,344 | Source | |
| Q1 2026 | CoreWeave | FY2026 Q1 | USD | 7,695 | 7,695 | 2,078 | 2,984 | Source | |
| Q1 2026 | Nebius | FY2026 Q1 | USD | 2,473 | 2,473 | 399 | 2,258 | Source | |
| Q1 2026 | xAI | 2026 Q1 | USD | 7,723 | 7,723 | – | – | Source | |
| Q1 2026 | Apple | FY2026 Q2 | USD | 1,971 | 1,971 | 111,184 | 28,702 | Source | |
| Q4 2025 | Amazon | FY2025 Q4 | USD | 39,522 | 39,522 | 213,386 | 54,459 | Source | |
| Q4 2025 | Microsoft | FY2026 Q2 | USD | 29,876 | 29,876 | 81,273 | 35,758 | Source | |
| Q4 2025 | Alphabet | FY2025 Q4 | USD | 27,851 | 27,851 | 113,829 | 52,402 | Source | |
| Q4 2025 | Meta | FY2025 Q4 | USD | 21,383 | 21,383 | 59,893 | 36,214 | Source | |
| Q4 2025 | Oracle | FY2026 Q2 | USD | 12,033 | 12,033 | 16,058 | 2,066 | Source | |
| Q4 2025 | Alibaba | FY2026 Q3 | CNY | 25,376 | 7.0889 | 3,580 | 40,182 | 5,083 | Source |
| Q4 2025 | Tencent | 2025 Q4 | CNY | 19,632 | 7.0889 | 2,769 | 27,419 | 9,381 | Source |
| Q4 2025 | Baidu | FY2025 Q4 | CNY | 1,972 | 7.0889 | 278 | 4,618 | 368 | Source |
| Q4 2025 | TSMC | FY2025 Q4 | TWD | 356,910 | 31.01 | 11,510 | 33,734 | 23,396 | Source |
| Q4 2025 | NVIDIA | FY2026 Q4 | USD | 1,284 | 1,284 | 68,127 | 36,188 | Source | |
| Q4 2025 | CoreWeave | FY2025 Q4 | USD | 4,060 | 4,060 | 1,572 | 1,559 | Source | |
| Q4 2025 | Nebius | FY2025 Q4 | USD | 2,056 | 2,056 | 228 | 834 | Source | |
| Q4 2025 | xAI | 2025 Q4 | USD | 4,650 | 4,650 | – | – | Source | |
| Q4 2025 | Apple | FY2026 Q1 | USD | 2,373 | 2,373 | 143,756 | 53,925 | Source | |
| Q3 2025 | Amazon | FY2025 Q3 | USD | 35,095 | 35,095 | 180,169 | 35,525 | Source | |
| Q3 2025 | Alphabet | FY2025 Q3 | USD | 23,953 | 23,953 | 102,346 | 48,414 | Source | |
| Q3 2025 | Microsoft | FY2026 Q1 | USD | 19,394 | 19,394 | 77,673 | 45,057 | Source | |
| Q3 2025 | Meta | FY2025 Q3 | USD | 18,829 | 18,829 | 51,242 | 29,999 | Source | |
| Q3 2025 | Oracle | FY2026 Q1 | USD | 8,502 | 8,502 | 14,926 | 8,140 | Source | |
| Q3 2025 | Alibaba | FY2026 Q2 | CNY | 31,428 | 7.157 | 4,391 | 34,623 | 1,411 | Source |
| Q3 2025 | Tencent | 2025 Q3 | CNY | 12,983 | 7.157 | 1,814 | 26,948 | 11,918 | Source |
| Q3 2025 | Baidu | FY2025 Q3 | CNY | 3,401 | 7.157 | 475 | 4,356 | 176 | Source |
| Q3 2025 | TSMC | FY2025 Q3 | TWD | 287,450 | 29.91 | 9,700 | 33,097 | 14,270 | Source |
| Q3 2025 | NVIDIA | FY2026 Q3 | USD | 1,636 | 1,636 | 57,006 | 23,751 | Source | |
| Q3 2025 | CoreWeave | FY2025 Q3 | USD | 2,389 | 2,389 | 1,365 | 1,689 | Source | |
| Q3 2025 | Nebius | FY2025 Q3 | USD | 956 | 956 | 146 | -81 | Source | |
| Q3 2025 | xAI | 2025 Q3 | USD | 4,760 | 4,760 | – | – | Source (from later filing) | |
| Q3 2025 | Apple | FY2025 Q4 | USD | 3,242 | 3,242 | 102,466 | 29,728 | Source | |
| Q2 2025 | Amazon | FY2025 Q2 | USD | 32,183 | 32,183 | 167,702 | 32,515 | Source | |
| Q2 2025 | Alphabet | FY2025 Q2 | USD | 22,446 | 22,446 | 96,428 | 27,747 | Source | |
| Q2 2025 | Microsoft | FY2025 Q4 | USD | 17,079 | 17,079 | 76,441 | 42,647 | Source | |
| Q2 2025 | Meta | FY2025 Q2 | USD | 16,538 | 16,538 | 47,516 | 25,561 | Source | |
| Q2 2025 | Oracle | FY2025 Q4 | USD | 9,080 | 9,080 | 15,903 | 6,157 | Source | |
| Q2 2025 | Alibaba | FY2026 Q1 | CNY | 38,629 | 7.2331 | 5,341 | 34,239 | 2,858 | Source |
| Q2 2025 | Tencent | 2025 Q2 | CNY | 19,107 | 7.2331 | 2,642 | 25,508 | 10,286 | Source |
| Q2 2025 | Baidu | FY2025 Q2 | CNY | 3,800 | 7.2331 | 525 | 4,523 | -121 | Source |
| Q2 2025 | TSMC | FY2025 Q2 | TWD | 297,220 | 31.05 | 9,572 | 30,074 | 16,009 | Source |
| Q2 2025 | NVIDIA | FY2026 Q2 | USD | 1,895 | 1,895 | 46,743 | 15,365 | Source | |
| Q2 2025 | CoreWeave | FY2025 Q2 | USD | 2,453 | 2,453 | 1,212 | -251 | Source | |
| Q2 2025 | Nebius | FY2025 Q2 | USD | 511 | 511 | 105 | -168 | Source (from later filing) | |
| Q2 2025 | xAI | 2025 Q2 | USD | 749 | 749 | – | – | Source (from later filing) | |
| Q2 2025 | Apple | FY2025 Q3 | USD | 3,462 | 3,462 | 94,036 | 27,867 | Source | |
| Q1 2025 | Amazon | FY2025 Q1 | USD | 25,019 | 25,019 | 155,667 | 17,015 | Source | |
| Q1 2025 | Alphabet | FY2025 Q1 | USD | 17,197 | 17,197 | 90,234 | 36,150 | Source | |
| Q1 2025 | Microsoft | FY2025 Q3 | USD | 16,745 | 16,745 | 70,066 | 37,044 | Source | |
| Q1 2025 | Meta | FY2025 Q1 | USD | 12,941 | 12,941 | 42,314 | 24,026 | Source | |
| Q1 2025 | Oracle | FY2025 Q3 | USD | 5,862 | 5,862 | 14,130 | 5,933 | Source | |
| Q1 2025 | Tencent | 2025 Q1 | CNY | 27,476 | 7.2728 | 3,778 | 24,753 | 10,574 | Source |
| Q1 2025 | Alibaba | FY2025 Q4 | CNY | 23,993 | 7.2728 | 3,299 | 32,512 | 3,784 | Source |
| Q1 2025 | Baidu | FY2025 Q1 | CNY | 2,900 | 7.2728 | 399 | 4,462 | -825 | Source |
| Q1 2025 | TSMC | FY2025 Q1 | TWD | 330,830 | 32.88 | 10,062 | 25,525 | 19,026 | Source |
| Q1 2025 | NVIDIA | FY2026 Q1 | USD | 1,227 | 1,227 | 44,062 | 27,414 | Source | |
| Q1 2025 | CoreWeave | FY2025 Q1 | USD | 1,407 | 1,407 | 982 | 61 | Source | |
| Q1 2025 | Nebius | FY2025 Q1 | USD | 544 | 544 | 51 | -184 | Source (from later filing) | |
| Q1 2025 | xAI | 2025 Q1 | USD | 2,568 | 2,568 | – | – | Source | |
| Q1 2025 | Apple | FY2025 Q2 | USD | 3,071 | 3,071 | 95,359 | 23,952 | Source | |
| Q4 2024 | Amazon | FY2024 Q4 | USD | 27,834 | 27,834 | 187,792 | 45,636 | Source | |
| Q4 2024 | Microsoft | FY2025 Q2 | USD | 15,804 | 15,804 | 69,632 | 22,291 | Source | |
| Q4 2024 | Meta | FY2024 Q4 | USD | 14,425 | 14,425 | 48,385 | 27,988 | Source | |
| Q4 2024 | Alphabet | FY2024 Q4 | USD | 14,276 | 14,276 | 96,469 | 39,113 | Source | |
| Q4 2024 | Oracle | FY2025 Q2 | USD | 3,970 | 3,970 | 14,059 | 1,304 | Source | |
| Q4 2024 | Tencent | 2024 Q4 | CNY | 36,578 | 7.1896 | 5,088 | 23,986 | 7,517 | Source (from later filing) |
| Q4 2024 | Alibaba | FY2025 Q3 | CNY | 31,369 | 7.1896 | 4,363 | 38,967 | 9,864 | Source |
| Q4 2024 | Baidu | FY2024 Q4 | CNY | 2,333 | 7.1896 | 324 | 4,746 | 328 | Source |
| Q4 2024 | TSMC | FY2024 Q4 | TWD | 361,950 | 32.3 | 11,206 | 26,887 | 19,202 | Source |
| Q4 2024 | NVIDIA | FY2025 Q4 | USD | 1,077 | 1,077 | 39,331 | 16,629 | Source | |
| Q4 2024 | CoreWeave | FY2024 Q4 | USD | 3,498 | 3,498 | 747 | 187 | Source | |
| Q4 2024 | Nebius | FY2024 Q4 | USD | 418 | 418 | 35 | -73 | Source (from later filing) | |
| Q4 2024 | Apple | FY2025 Q1 | USD | 2,940 | 2,940 | 124,300 | 29,935 | Source | |
| Q3 2024 | Amazon | FY2024 Q3 | USD | 22,620 | 22,620 | 158,877 | 25,971 | Source | |
| Q3 2024 | Microsoft | FY2025 Q1 | USD | 14,923 | 14,923 | 65,585 | 34,180 | Source | |
| Q3 2024 | Alphabet | FY2024 Q3 | USD | 13,061 | 13,061 | 88,268 | 30,698 | Source | |
| Q3 2024 | Meta | FY2024 Q3 | USD | 8,258 | 8,258 | 40,589 | 24,724 | Source | |
| Q3 2024 | Oracle | FY2025 Q1 | USD | 2,303 | 2,303 | 13,307 | 7,427 | Source | |
| Q3 2024 | Tencent | 2024 Q3 | CNY | 17,094 | 7.1641 | 2,386 | 23,338 | 10,890 | Source (from later filing) |
| Q3 2024 | Alibaba | FY2025 Q2 | CNY | 16,977 | 7.1641 | 2,370 | 33,012 | 4,388 | Source |
| Q3 2024 | Baidu | FY2024 Q3 | CNY | 1,645 | 7.1641 | 230 | 4,684 | 597 | Source |
| Q3 2024 | TSMC | FY2024 Q3 | TWD | 207,080 | 32.32 | 6,407 | 23,505 | 12,128 | Source |
| Q3 2024 | NVIDIA | FY2025 Q3 | USD | 813 | 813 | 35,082 | 17,627 | Source | |
| Q3 2024 | CoreWeave | FY2024 Q3 | USD | 1,215 | 1,215 | 584 | 641 | Source | |
| Q3 2024 | Nebius | FY2024 Q3 | USD | 172 | 172 | 32 | -35 | Source (from later filing) | |
| Q3 2024 | Apple | FY2024 Q4 | USD | 2,908 | 2,908 | 94,930 | 26,811 | Source | |
| Q2 2024 | Amazon | FY2024 Q2 | USD | 17,620 | 17,620 | 147,977 | 25,281 | Source | |
| Q2 2024 | Microsoft | FY2024 Q4 | USD | 13,873 | 13,873 | 64,727 | 37,195 | Source | |
| Q2 2024 | Alphabet | FY2024 Q2 | USD | 13,186 | 13,186 | 84,742 | 26,640 | Source | |
| Q2 2024 | Meta | FY2024 Q2 | USD | 8,173 | 8,173 | 39,071 | 19,370 | Source | |
| Q2 2024 | Oracle | FY2024 Q4 | USD | 2,798 | 2,798 | 14,287 | 6,081 | Source | |
| Q2 2024 | Alibaba | FY2025 Q1 | CNY | 11,939 | 7.241 | 1,649 | 33,592 | 4,645 | Source |
| Q2 2024 | Tencent | 2024 Q2 | CNY | 8,729 | 7.241 | 1,206 | 22,251 | 7,472 | Source (from later filing) |
| Q2 2024 | Baidu | FY2024 Q2 | CNY | 2,118 | 7.241 | 292 | 4,686 | 1,157 | Source |
| Q2 2024 | TSMC | FY2024 Q2 | TWD | 205,680 | 32.35 | 6,358 | 20,820 | 11,674 | Source |
| Q2 2024 | NVIDIA | FY2025 Q2 | USD | 977 | 977 | 30,040 | 14,488 | Source | |
| Q2 2024 | CoreWeave | FY2024 Q2 | USD | 2,247 | 2,247 | 395 | -118 | Source | |
| Q2 2024 | Nebius | FY2024 Q2 | USD | 159 | 159 | 14 | -99 | Source (from later filing) | |
| Q2 2024 | Apple | FY2024 Q3 | USD | 2,151 | 2,151 | 85,777 | 28,858 | Source | |
| Q1 2024 | Amazon | FY2024 Q1 | USD | 14,925 | 14,925 | 143,313 | 18,989 | Source | |
| Q1 2024 | Alphabet | FY2024 Q1 | USD | 12,012 | 12,012 | 80,539 | 28,848 | Source | |
| Q1 2024 | Microsoft | FY2024 Q3 | USD | 10,952 | 10,952 | 61,858 | 31,917 | Source | |
| Q1 2024 | Meta | FY2024 Q1 | USD | 6,400 | 6,400 | 36,455 | 19,246 | Source | |
| Q1 2024 | Oracle | FY2024 Q3 | USD | 1,674 | 1,674 | 13,280 | 5,475 | Source | |
| Q1 2024 | Tencent | 2024 Q1 | CNY | 14,359 | 7.1885 | 1,998 | 22,188 | 10,065 | Source (from later filing) |
| Q1 2024 | Alibaba | FY2024 Q4 | CNY | 10,174 | 7.1885 | 1,415 | 30,865 | 3,247 | Source |
| Q1 2024 | Baidu | FY2024 Q1 | CNY | 2,038 | 7.1885 | 284 | 4,384 | 865 | Source |
| Q1 2024 | TSMC | FY2024 Q1 | TWD | 181,300 | 31.4 | 5,774 | 18,874 | 13,895 | Source |
| Q1 2024 | NVIDIA | FY2025 Q1 | USD | 369 | 369 | 26,044 | 15,345 | Source | |
| Q1 2024 | CoreWeave | FY2024 Q1 | USD | 1,742 | 1,742 | 189 | 2,039 | Source | |
| Q1 2024 | Apple | FY2024 Q2 | USD | 1,996 | 1,996 | 90,753 | 22,690 | Source | |
| Q4 2023 | Amazon | FY2023 Q4 | USD | 14,588 | 14,588 | 169,961 | 42,465 | Source | |
| Q4 2023 | Alphabet | FY2023 Q4 | USD | 11,019 | 11,019 | 86,310 | 18,915 | Source | |
| Q4 2023 | Microsoft | FY2024 Q2 | USD | 9,735 | 9,735 | 62,020 | 18,853 | Source | |
| Q4 2023 | Meta | FY2023 Q4 | USD | 7,592 | 7,592 | 40,111 | 19,404 | Source | |
| Q4 2023 | Oracle | FY2024 Q2 | USD | 1,080 | 1,080 | 12,941 | 143 | Source | |
| Q4 2023 | Tencent | 2023 Q4 | CNY | 7,524 | 7.2247 | 1,041 | 21,481 | 7,468 | Source |
| Q4 2023 | Alibaba | FY2024 Q3 | CNY | 7,286 | 7.2247 | 1,008 | 36,036 | 8,958 | Source |
| Q4 2023 | Baidu | FY2023 Q4 | CNY | 3,660 | 7.2247 | 507 | 4,838 | 1,470 | Source |
| Q4 2023 | TSMC | FY2023 Q4 | TWD | 170,160 | 31.88 | 5,240 | 19,621 | 12,385 | Source |
| Q4 2023 | NVIDIA | FY2024 Q4 | USD | 254 | 254 | 22,103 | 11,499 | Source | |
| Q4 2023 | Apple | FY2024 Q1 | USD | 2,392 | 2,392 | 119,575 | 39,895 | Source | |
| Q3 2023 | Amazon | FY2023 Q3 | USD | 12,479 | 12,479 | 143,083 | 21,217 | Source | |
| Q3 2023 | Microsoft | FY2024 Q1 | USD | 9,917 | 9,917 | 56,517 | 30,583 | Source | |
| Q3 2023 | Alphabet | FY2023 Q3 | USD | 8,055 | 8,055 | 76,693 | 30,656 | Source | |
| Q3 2023 | Meta | FY2023 Q3 | USD | 6,496 | 6,496 | 34,146 | 20,402 | Source | |
| Q3 2023 | Oracle | FY2024 Q1 | USD | 1,314 | 1,314 | 12,453 | 6,974 | Source | |
| Q3 2023 | Tencent | 2023 Q3 | CNY | 8,005 | 7.2445 | 1,105 | 21,344 | 8,976 | Source |
| Q3 2023 | Alibaba | FY2024 Q2 | CNY | 4,112 | 7.2445 | 568 | 31,029 | 6,796 | Source |
| Q3 2023 | Baidu | FY2023 Q3 | CNY | 3,529 | 7.2445 | 487 | 4,755 | 1,315 | Source |
| Q3 2023 | TSMC | FY2023 Q3 | TWD | 226,620 | 31.64 | 7,100 | 17,280 | 9,313 | Source |
| Q3 2023 | NVIDIA | FY2024 Q3 | USD | 278 | 278 | 18,120 | 7,332 | Source | |
| Q3 2023 | Apple | FY2023 Q4 | USD | 2,163 | 2,163 | 89,498 | 21,598 | Source | |
| Q2 2023 | Amazon | FY2023 Q2 | USD | 11,455 | 11,455 | 134,383 | 16,476 | Source | |
| Q2 2023 | Microsoft | FY2023 Q4 | USD | 8,943 | 8,943 | 56,189 | 28,770 | Source | |
| Q2 2023 | Alphabet | FY2023 Q2 | USD | 6,888 | 6,888 | 74,604 | 28,666 | Source | |
| Q2 2023 | Meta | FY2023 Q2 | USD | 6,134 | 6,134 | 31,999 | 17,309 | Source | |
| Q2 2023 | Oracle | FY2023 Q4 | USD | 1,913 | 1,913 | 13,836 | 5,647 | Source | |
| Q2 2023 | Alibaba | FY2024 Q1 | CNY | 6,007 | 7.013 | 857 | 33,389 | 6,460 | Source |
| Q2 2023 | Tencent | 2023 Q2 | CNY | 3,953 | 7.013 | 564 | 21,276 | 5,802 | Source |
| Q2 2023 | Baidu | FY2023 Q2 | CNY | 2,706 | 7.013 | 386 | 4,856 | 1,516 | Source |
| Q2 2023 | TSMC | FY2023 Q2 | TWD | 250,530 | 30.67 | 8,169 | 15,678 | 5,453 | Source |
| Q2 2023 | NVIDIA | FY2024 Q2 | USD | 289 | 289 | 13,507 | 6,348 | Source | |
| Q2 2023 | Apple | FY2023 Q3 | USD | 2,093 | 2,093 | 81,797 | 26,380 | Source | |
| Q1 2023 | Amazon | FY2023 Q1 | USD | 14,207 | 14,207 | 127,358 | 4,788 | Source | |
| Q1 2023 | Meta | FY2023 Q1 | USD | 6,823 | 6,823 | 28,645 | 13,998 | Source | |
| Q1 2023 | Microsoft | FY2023 Q3 | USD | 6,607 | 6,607 | 52,857 | 24,441 | Source | |
| Q1 2023 | Alphabet | FY2023 Q1 | USD | 6,289 | 6,289 | 69,787 | 23,509 | Source | |
| Q1 2023 | Oracle | FY2023 Q3 | USD | 2,628 | 2,628 | 12,398 | 4,275 | Source | |
| Q1 2023 | Tencent | 2023 Q1 | CNY | 4,411 | 6.8423 | 645 | 21,920 | 9,105 | Source |
| Q1 2023 | Alibaba | FY2023 Q4 | CNY | 2,513 | 6.8423 | 367 | 30,428 | 4,589 | Source (from later filing) |
| Q1 2023 | Baidu | FY2023 Q1 | CNY | 1,295 | 6.8423 | 189 | 4,552 | 854 | Source |
| Q1 2023 | TSMC | FY2023 Q1 | TWD | 302,500 | 30.42 | 9,944 | 16,720 | 12,664 | Source |
| Q1 2023 | NVIDIA | FY2024 Q1 | USD | 248 | 248 | 7,192 | 2,911 | Source | |
| Q1 2023 | Apple | FY2023 Q2 | USD | 2,916 | 2,916 | 94,836 | 28,560 | Source |
Data file
One row per company and calendar quarter, in US$ millions. Columns ending “_quarter” are for that quarter alone; debt is at quarter end; “_pct” columns are percentages. The JSON adds company summaries, all guidance quotes, the AI-share methods, commitments and the corrections log. The “latest” links always point to the newest version; dated copies never change. Every column is described in the README.
Download and cite
Always the latest version. This version: 2026-11-03.csv · 2026-11-03.json
DailyAI, “AI capex tracker”, https://dailyai.com/trackers/ai-capex/, version 2026-11-03. CC BY 4.0.
Free to reuse: any chart or figure on this page may be republished with credit to DailyAI and a link to this page (CC BY 4.0). Use the Embed button under each chart.